Optimizing a RISC-V Emulator
Succinct Labs put out a challenge to make their RISC-V emulator faster, so I gave it a shot. I expected a quick fix. It turned into a lot of profiling and figuring out where the time actually goes.
§ The challenge
Here’s the challenge. Their emulator runs about 2 million instructions per second, and they wanted it faster.
The setup:
[Input Buffer] → [RSP Program] → [RISC-V Emulator] → [Output Hash]Think of it as a kitchen:
- RSP Program: A recipe (program written for RISC-V)
- Input Buffer: The ingredients (data the program needs)
- RISC-V Emulator: A kitchen that follows RISC-V recipes
The benchmark runs the emulator 5 times, measures performance in MHzMHz here means millions of RISC-V instructions per second, not the CPU clock rate (millions of operations per second), and verifies correctness by checking output hashes.
§ Starting point
On my laptop, it was slow:
===== BENCHMARK RESULTS =====
Runs: 5
Average elapsed: 25.2662 seconds
Average MHz: 2.22
My setup:
- OS: Pop!_OS 22.04 LTS
- CPU: Intel i5-3210M (4 cores)
- Memory: ~5.8 GB RAM
For comparison, Succinct’s AWS m7i.8xlarge instance got 9.35 MHz, so that was my target.
§ Finding the bottlenecks
Before changing anything, I profiled it with cargo instruments to see where the time was going.
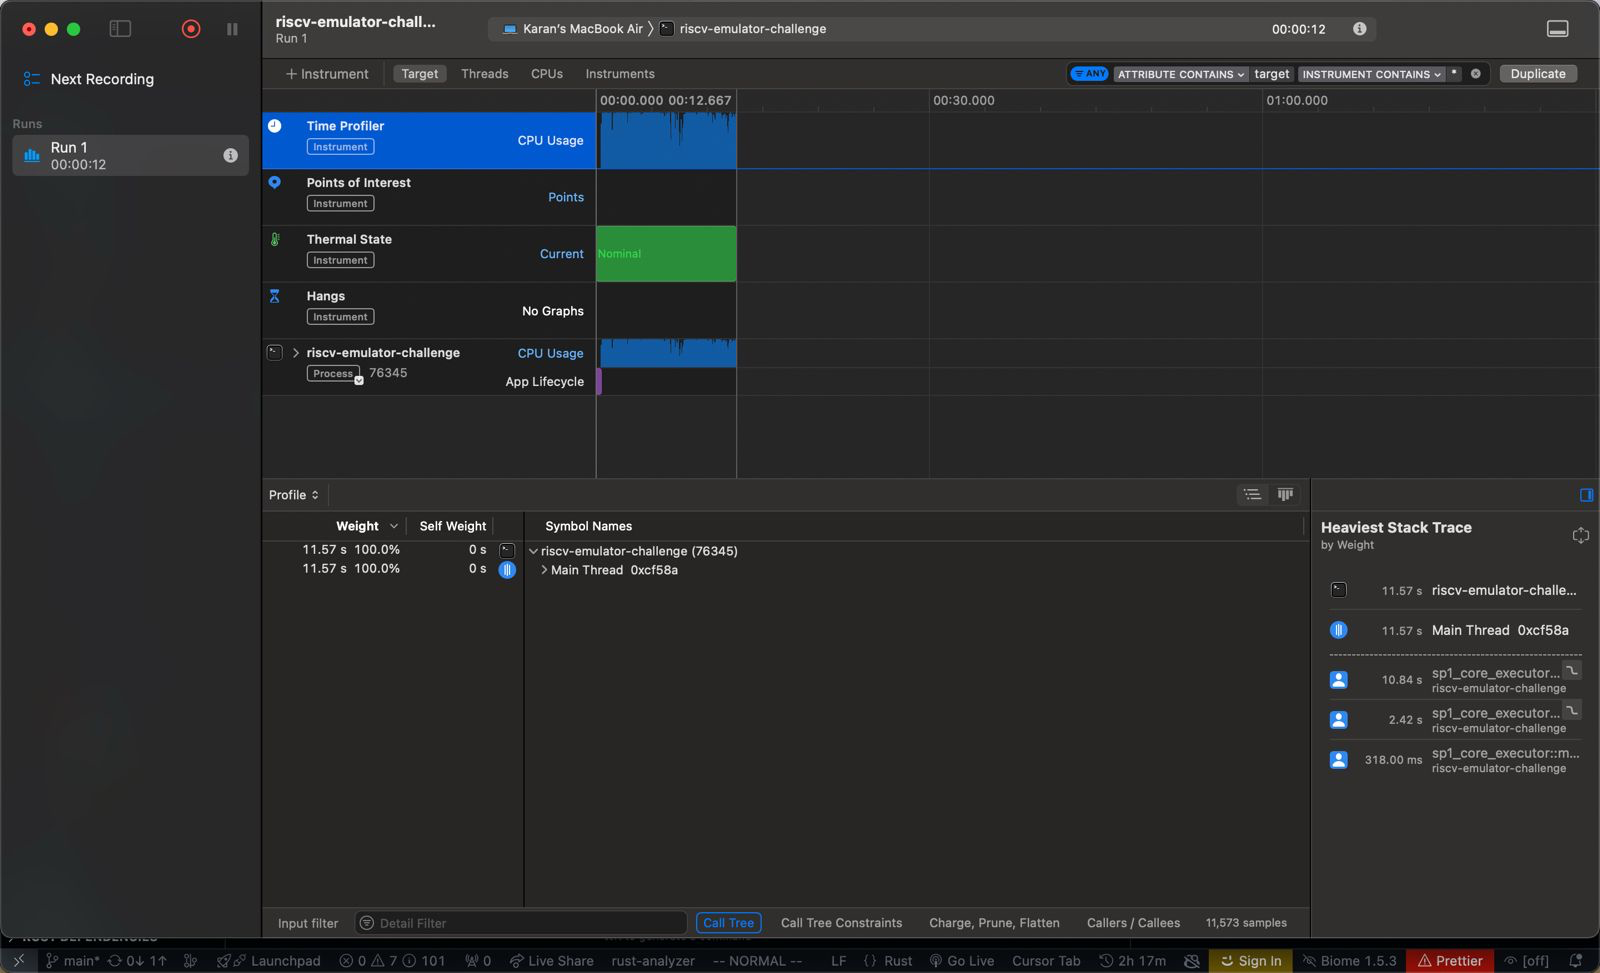
The top of the profile:
Time    % of Total   Function
2.42 s   21.2%      Memory write operations (mw)
1.65 s   14.4%      Load register-register (load_rr)
1.39 s   12.2%      ALU register-register (alu_rr)
1.34 s   11.8%      Store register-register (store_rr)
Nearly 60% of execution time was spent on these four operations, and memory writes were the biggest one.
§ Optimization #1: Faster address translation
The original address translation checked an assertion on every memory access:
fn translate_addr(addr: u32) -> u32 {
    assert!(addr >= 0x10000);  // This runs every single time!
    (addr - 0x10000) >> 2
}
That runs millions of times, so it adds up. My version:
#[inline(always)]
fn translate_addr(addr: u32) -> u32 {
    // Fast path for registers
    if addr < 32 {
        return addr;
    }
    // Only check assertion in debug builds
    #[cfg(debug_assertions)]
    assert!(addr >= 0x10000);
    (addr - 0x10000) >> 2
}
It adds a fast path for register addresses, only checks the assertion in debug builds, and is inlined so there’s no call overhead.
§ Optimization #2: Register access
The register access code had redundant array indexing:
// Before: accessing the same array index multiple times
if self.registers[addr as usize].is_some() {
    return MemEntry::Occupied(MemOccupied::Register(
        self.registers[addr as usize].as_mut().unwrap(),
    ));
}
return MemEntry::Vacant(MemVacant::Register(&mut self.registers[addr as usize]));
I changed it to grab the reference once:
// After: get the reference once, use it multiple times
if addr < 32 {
    let reg = &mut self.registers[addr as usize];
    return if reg.is_some() {
        MemEntry::Occupied(MemOccupied::Register(reg.as_mut().unwrap()))
    } else {
        MemEntry::Vacant(MemVacant::Register(reg))
    };
}
Fewer array accesses, and easier on the branch predictor.
§ Optimization #3: The HashMap
Memory writes were 21.2% of the time, so I suspected the HashMap. I tried a few things.
§ Custom hasher (didn’t use)
I wrote a custom MurmurHash-based hasher to replace the default SipHash:
struct MemoryHasher { state: u64 }

impl std::hash::Hasher for MemoryHasher {
    fn finish(&self) -> u64 { self.state }
    fn write(&mut self, bytes: &[u8]) {
        let key = u32::from_ne_bytes(bytes.try_into().expect("u32 keys only"));
        let mut h = key as u64;
        h ^= h >> 33;
        h *= 0xff51afd7ed558ccd; // MurmurHash magic numbers
        h ^= h >> 33;
        h *= 0xc4ceb9fe1a85ec53;
        h ^= h >> 33;
        self.state = h;
    }
}
It was faster than SipHash (10-15 cycles vs 50-100), but still slower than no hashing at all. So I tried no hashing.
§ No-hash hasher (13x slower)
I tried BuildNoHashHasher, thinking sequential addresses would work well:
type MemoryHasher = BuildNoHashHasher<u32>;It was 13x slower. Hash collisions killed it.
§ Optimization #4: Vec-based memory
So I dropped the HashMap and used a Vec:
// Before: HashMap with hashing overhead
pub struct MemoryMap<V> {
    pub registers: [Option<V>; 32],
    memory: HashMap<u32, V, BuildMemoryHasher>,
}

// After: Direct indexing with Vec
pub struct MemoryMap<V: Clone> {
    pub registers: [Option<V>; 32],
    memory: Vec<Option<V>>,
}
This works because RISC-V memory addresses translate to sequential indices, so the Vec is indexed directly: no hashing, O(1) access, and better cache locality. I pre-allocate 4MiB, which is what typical programs need:
pub fn new() -> Self {
    Self::with_capacity(1 << 20) // 1,048,576 entries = 4MiB
}
Larger programs just grow the Vec.
§ Optimization #5: Register cache
Register access was still taking 14.4% of execution time. I added a register cache:
pub struct Executor<'a> {
    // ... other fields ...
    register_cache: [Option<u32>; 32],
    register_dirty: [bool; 32],
}
§ Reads
#[inline(always)]
pub fn rr(&mut self, register: Register, position: MemoryAccessPosition) -> u32 {
    let reg_idx = register as usize;

    // Fast path: check cache first
    if let Some(value) = self.register_cache[reg_idx] {
        return value;
    }

    // Slow path: load from memory map
    // ... fallback code ...
}
§ Writes
#[inline(always)]
pub fn rw(&mut self, register: Register, value: u32) {
    // Fast path for x0 (always zero in RISC-V)
    if register == Register::X0 {
        return;
    }

    let reg_idx = register as usize;
    self.register_cache[reg_idx] = Some(value);
    self.register_dirty[reg_idx] = true;

    // Defer memory map updates until checkpoint
    if self.executor_mode == ExecutorMode::Checkpoint {
        self.flush_register(register);
    } else {
        self.mw_cpu(register as u32, value, MemoryAccessPosition::A);
    }
}
Most register reads are now a plain array access, x0 writes return right away, writes to the memory map are deferred, and the dirty flags track which registers need flushing.
§ Results
Put together: no hashing (Vec instead of HashMap), a register cache, inlining, and a faster path for register access. The emulator got a lot faster and still produced the right output hashes.
§ Future ideas
Two things I considered but didn’t do:
Inter-shard caching: cache hot instruction metadata across the 2M-cycle shards that make up a full program run.
Global caching: keep compiled instruction blocks across benchmark runs, basically JIT compilation for programs that run repeatedly.
The overhead probably wouldn’t pay off for a single run, but it could give 20-30% when the same program runs again and again.
§ What I took away
Profile before guessing. The biggest win came from not doing the work at all (a Vec instead of a HashMap), and that only worked because RISC-V memory addresses are sequential. Cache what’s hot: registers get hit often enough to be worth it. And measure everything, because the “obvious” no-hash idea made things 13x slower.
Subscribe for future posts